Center for Complexity and Self-Management of Chronic Disease
(CSCD): Core 2: Methods and Analytics Progress (2018-2019)
In 2018-2019, investigators in the CSCD Methods and Analytics core continued to
make significant advances. First we developed a powerful protocol enabling data
sharing and aggregation via statistical obfuscation. Second, we introducing a new
compressive big data analytics (CBDA) framework for analyzing biomedical and
health studies. Third, we deployed an advanced visualization webapp for
interrogating extremely-high dimensional data.
This brief progress report outlines some of these developments.
I. Support for Open Data-Sharing
In support of open-science, we developed a novel statistical approach that enables the
harmonization, merging, and sharing of complex datasets without compromising sensitive
information like person identifiable elements
(
NIHMSID 1012970, DOI: 10.1080/00949655.2018.1545228).
The DataSifter provides on-the-fly de-identification of structured and unstructured
sensitive high-dimensional data such as clinical data from electronic health records
(EHR). The technique provides complete administrative control over the balance
between risk of data re-identification and preservation of the data information.
Our simulation results suggest that the DataSifter can provide privacy protection
while maintaining data utility for different types of outcomes of interest.
The application of DataSifter on a large autism dataset provides a realistic
demonstration of its promise practical applications.
II. Application of Compressive Big Data Analytics (CBDA) in Biomedical and Health Studies
We introduced a scalable computational statistics method for addressing some of the challenges
associated with handling complex, incongruent, incomplete and multi-source
data and analytics challenges. The CBDA mathematical framework enables the
study of the ergodic properties and the asymptotics of the specific
statistical inference approaches. We implemented and validated the
high-throughput CBDA method using pure R and several simulated datasets
as well as a real neuroimaging-genetics of Alzheimer's disease case-study
(
PMCID: PMC6116997, DOI: 10.1371/journal.pone.0202674).
III. Visualization of High-dimensional Diabetes Data
We developed a
distributed webapp for visually interrogating complex data
archives. It allows all users to address health questions like:
Do patient phenotypes (e.g., race, gender, and age), clinical settings
(e.g., admission type, time in hospital, medical specialty of admitting
physician), and treatment regiments (e.g., number of lab test performed,
HbA1c test result, diagnosis, number of medication, diabetes medications,
number of outpatient, inpatient, and emergency visits in the year before
the hospitalization) affect diabetes treatment outcomes?
Examples of specific driving healthcare challenges that can be addressed
include:
- Data science and predictive analytics (DSPA) data wrangling
methods to preprocess the data and generate a computable data object.
- The use of linear (PCA) and non-linear (t-SNE) dimensionality reduction methods to
project the high-dimensional data into 2D or 3D space.
- Visual and exploratory data analytics to interrogate the low-dimensional projection,
identify clusters of patients, and explore the intrinsic lower-dimensional structure of
the data.
This open-science project provides a low-cost solution for interactive
visual analytics, hypothesis generation, and pattern identification for
complex biomedical and healthcare case-studies. It does not require any
special software or licensing and supports evidence-based discovery
science and provides semi-automated clinical decision support for health
practitioners.
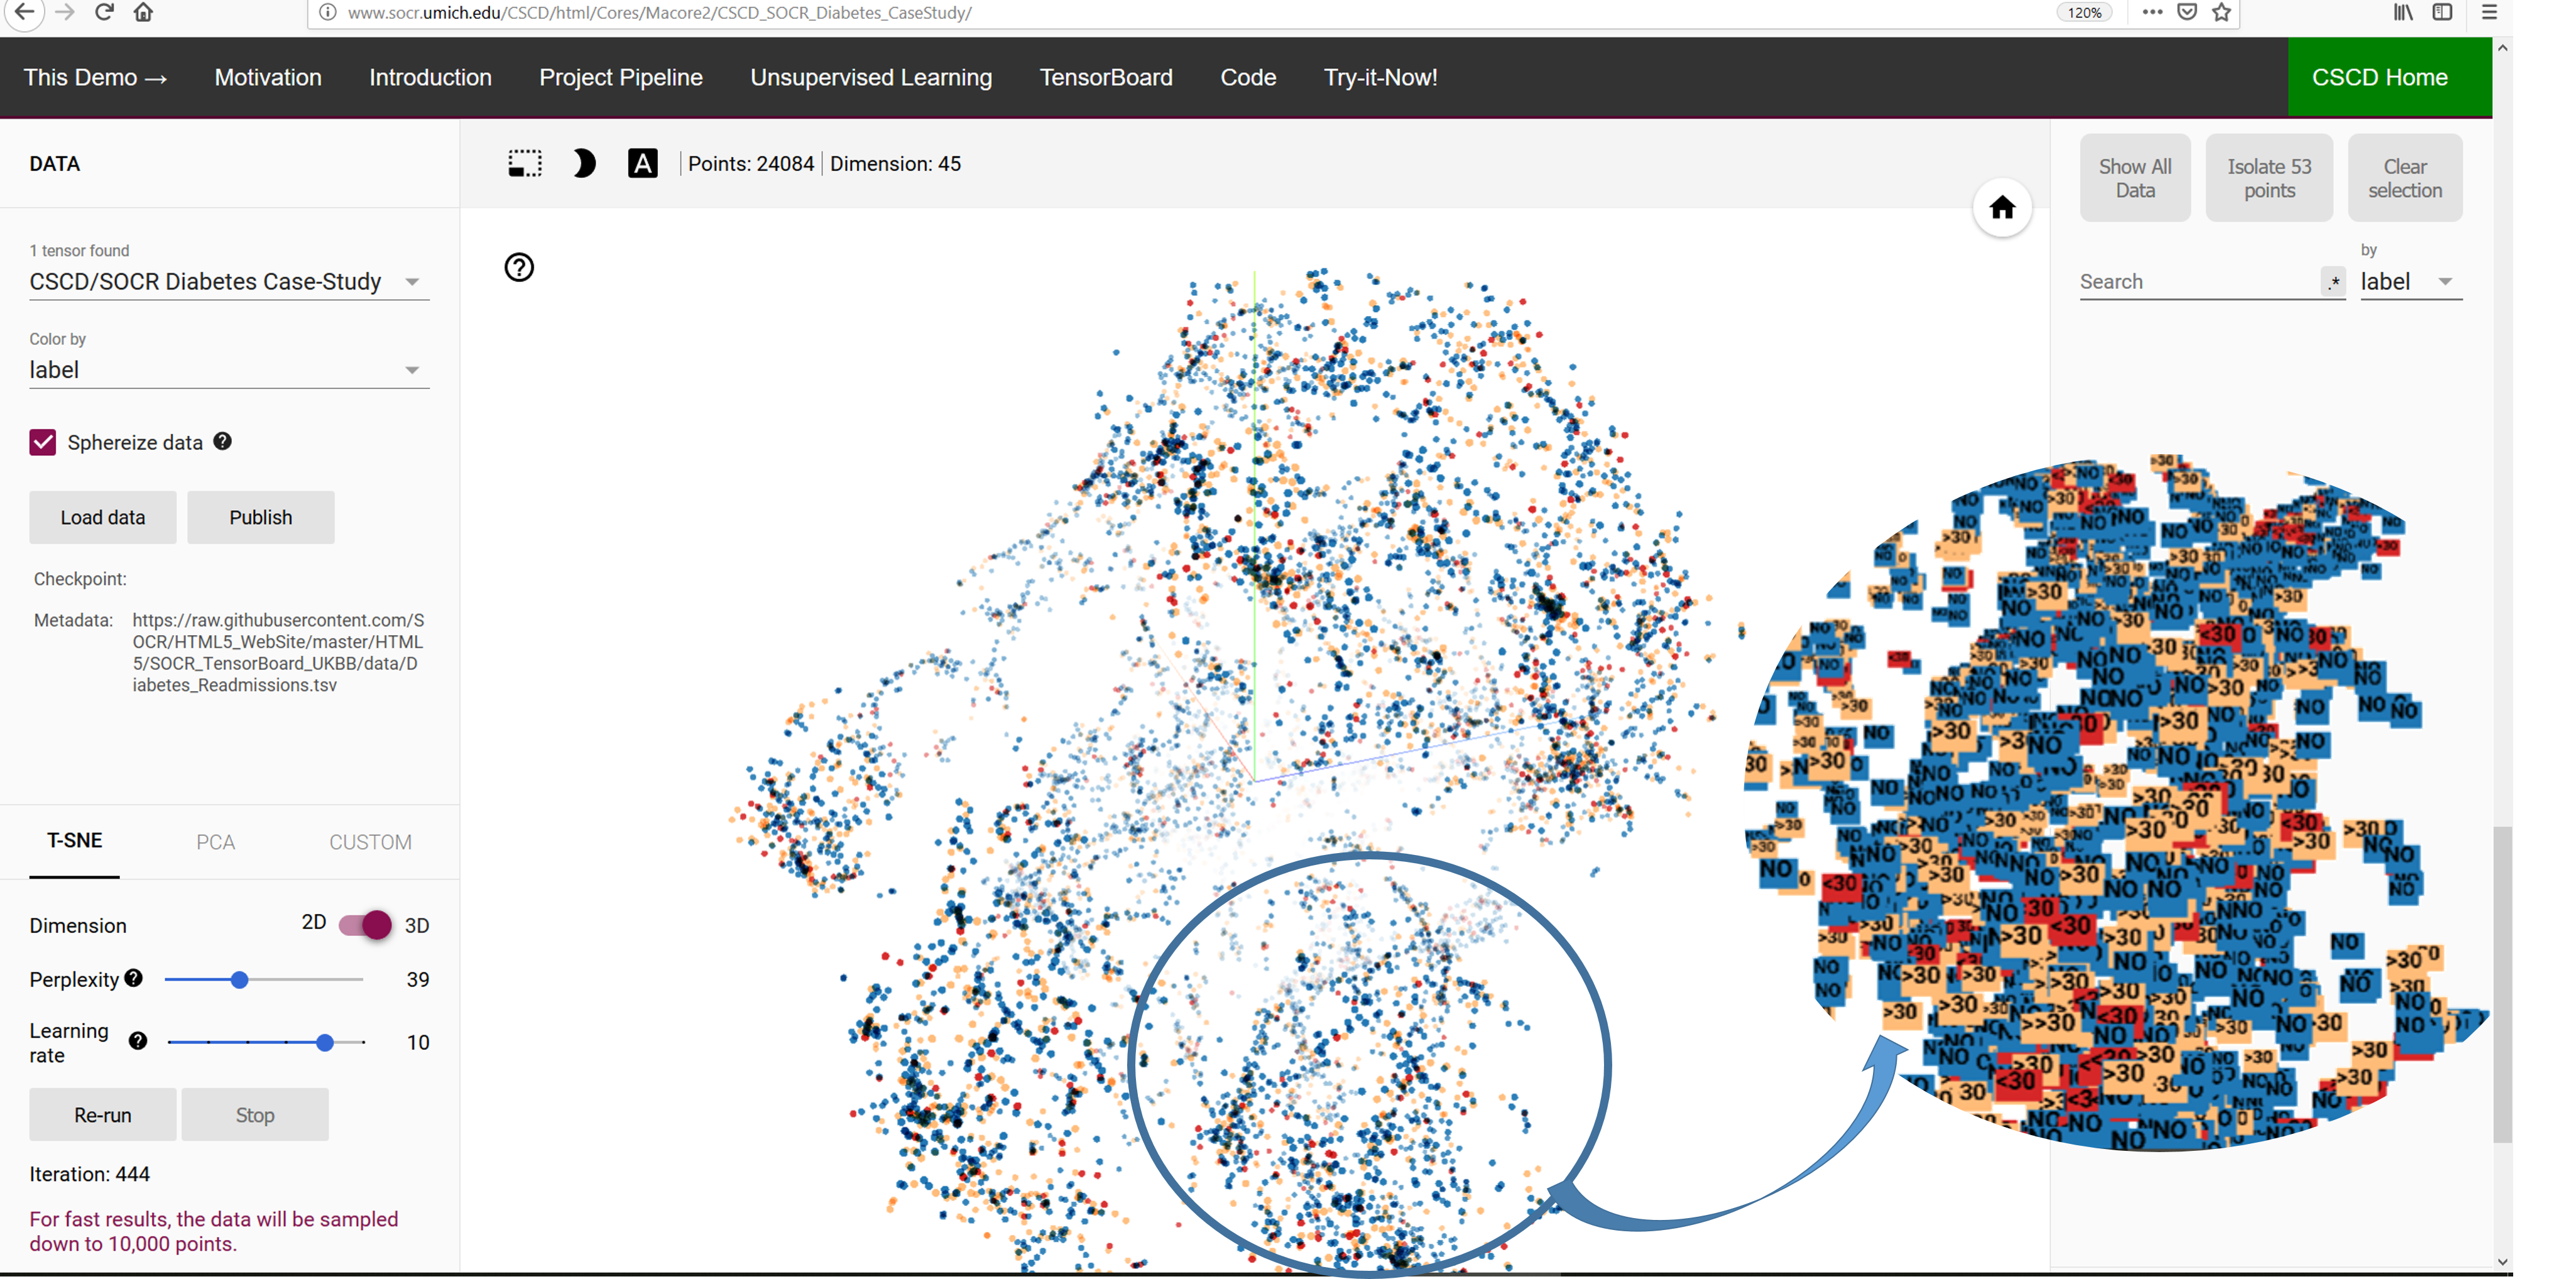
Figure: Visualization of the high-dimensional Diabetes data into 3D, using t-SNE.
This
CSCD TensorBoard application provides a tutorial and a high-end
visualization protocol for interrogating extremely high-dimensional data.
Users may upload and interrogate their own data into the webapp.
.
IV. Curricular Developments
- A new data science course has been approved and
was offered as a Summer MOOC course. It builds technical skills and provides
a tool chest of resources to manage and interrogate heterogeneous datasets.
- An electronic textbook (EBook) on
Scientific Methods for Health Sciences is developed and
widely shared with the entire community. This multilingual EBook is utilized by over 50,000 users worldwide.