Center for Complexity and Self-Management of Chronic Disease
(CSCD): Core 2: Methods and Analytics Progress (2014-2015)
The main 2014-2015 accomplishments of the Methods and Analytics core
include: publications, infrastucrture and high-throughput data analytics.
I. Research Publications
PMCID: PMC4310910:
This study examined cognitive decline in
early-onset Alzheimer's Disease patients. Chronicity and complexity
of cognitive impairment drive the need for development of
innovative methods and protocols for fusing multi-source data to
derive biomarkers that capture the progression of neurodegeneration
and identify associations between neuroimaging, genetics and
clinical observations. We developed a complex pipeline workflow
protocol for modeling, analysis and visualization of the data and
showed significant associations between genetics (e.g.,
SNP/rs7718456) and various morphometry measures of regional brain
anatomy (e.g., left hippocampal volume).
II. Infrastructure
Deployed and continuously expanding the
CSCD Center
web-infrastructure.
III. High-Throughput Data Analytics Workflows
CSCD MACORE investigators develop efficient and reliable end-to-end
computational workflow solutions for advanced data analytics (see
CSCD shared resources). One
example of such complex computational protocol is described below.
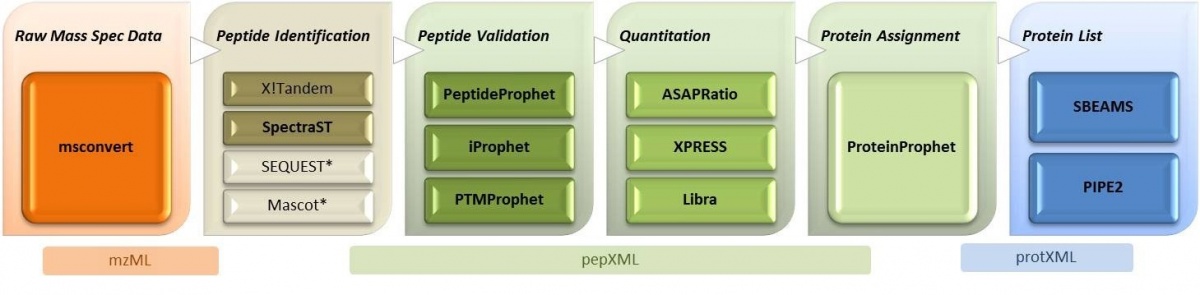
The
Trans-Proteomics Pipeline (TPP) tutorial is shown
below. We developed a distributed workflow, based on the
Pipeline
Environment that efficiently implements the TPP pipeline.
Workflow Protocol
These steps illustrate the complete pipeline users can follow
to start the Pipeline client, load the Pipeline graphical
representation of the TPP workflow, as a network, execute the
workflow and retrieve intermediate and final results:
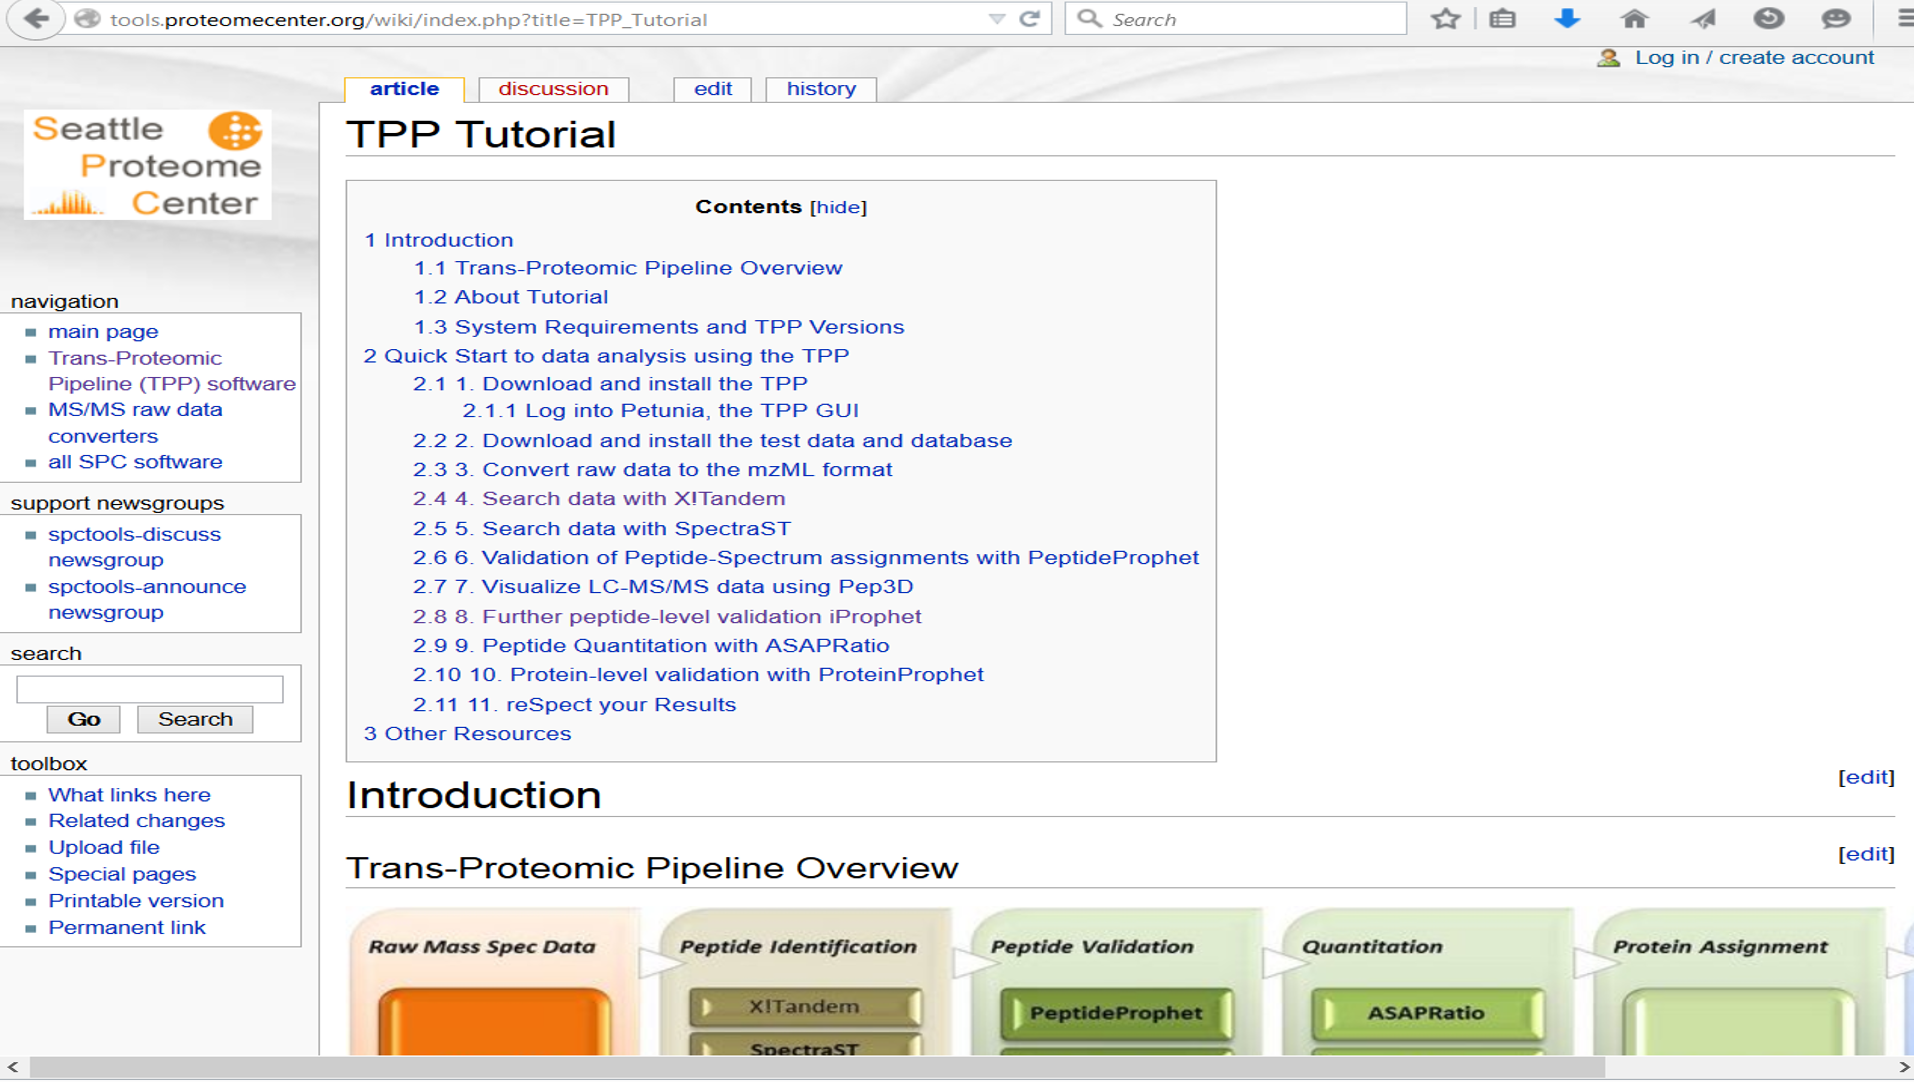
Open a web-browser
Load the
Pipeline TPP in your browser, or directly go to
http://bit.ly/1BROUxz.
http://pipeline.loni.usc.edu/files/serverlib/view_workflow.php?file=/Training/Groups/TPP_Tutorial.pipe
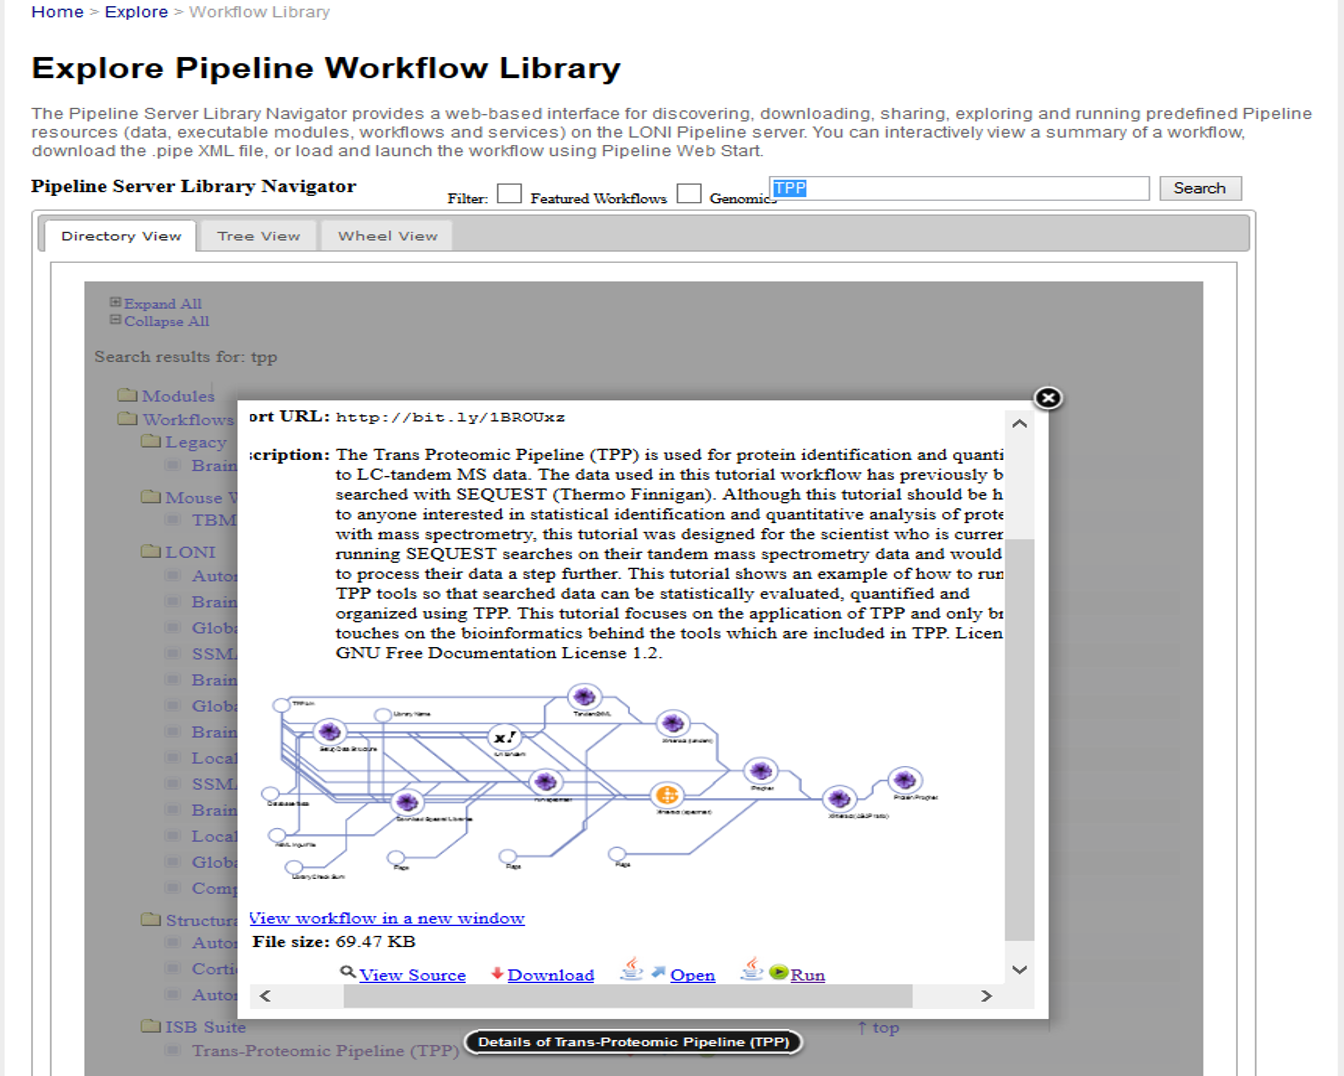
Workflow Controls
Use the “View Source”, “Open”, “Download”, or “Run” options
(bottom) to see, load, retrieve or start the TPP pipeline workflow
(using guest-user credentials) on the LONI/INI/USC Pipeline
Try-It-Now server.
- If you already have a user account on LONI and prefer
to start your Pipeline client you can download the workflow and
drag-and-drop it in the Pipeline canvas to display the TPP
protocol as a pipeline workflow graph.
- Another alternative is the load the TPP workflow from
the LONI Cranium server library (see left hand-size), by
double-clicking the TPP workflow under the ISB Suite.
- TPP Pipeline Workflow (TPP_V2.pipe)
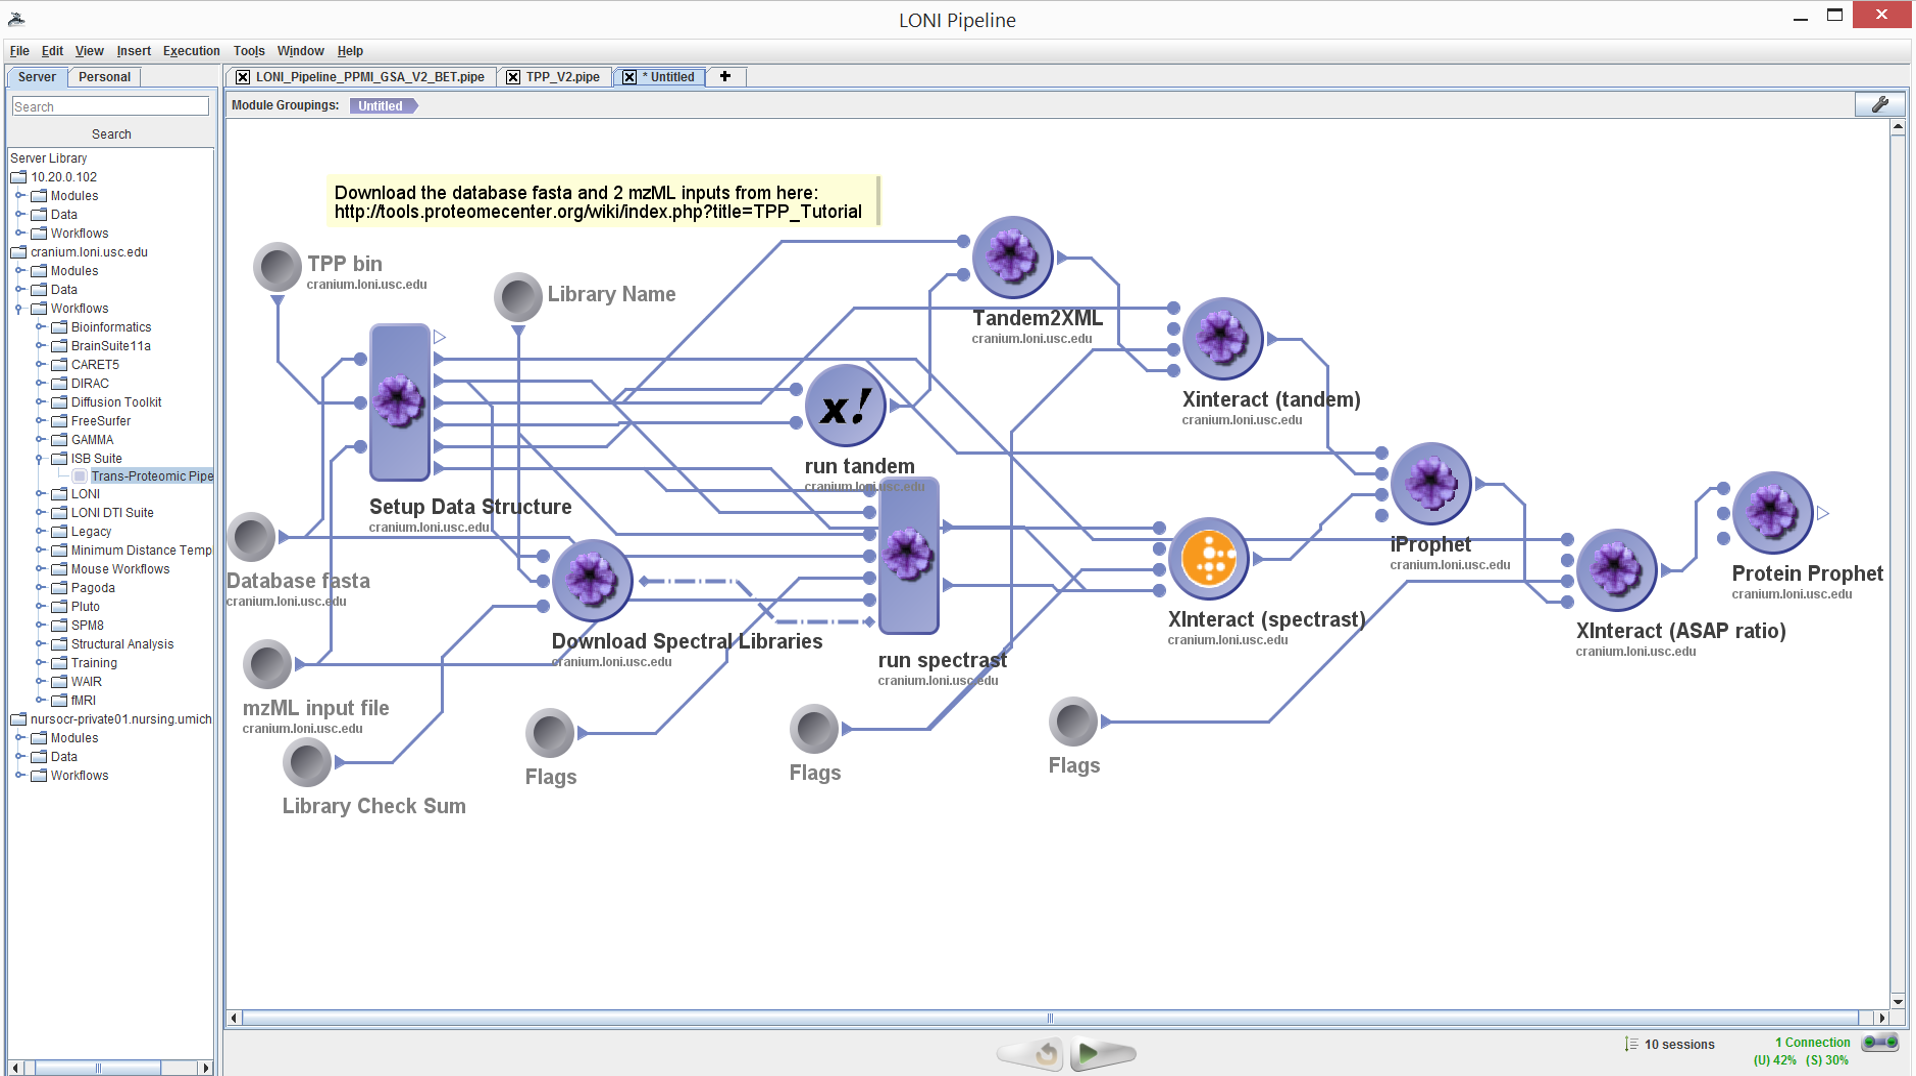
Run the pipeline
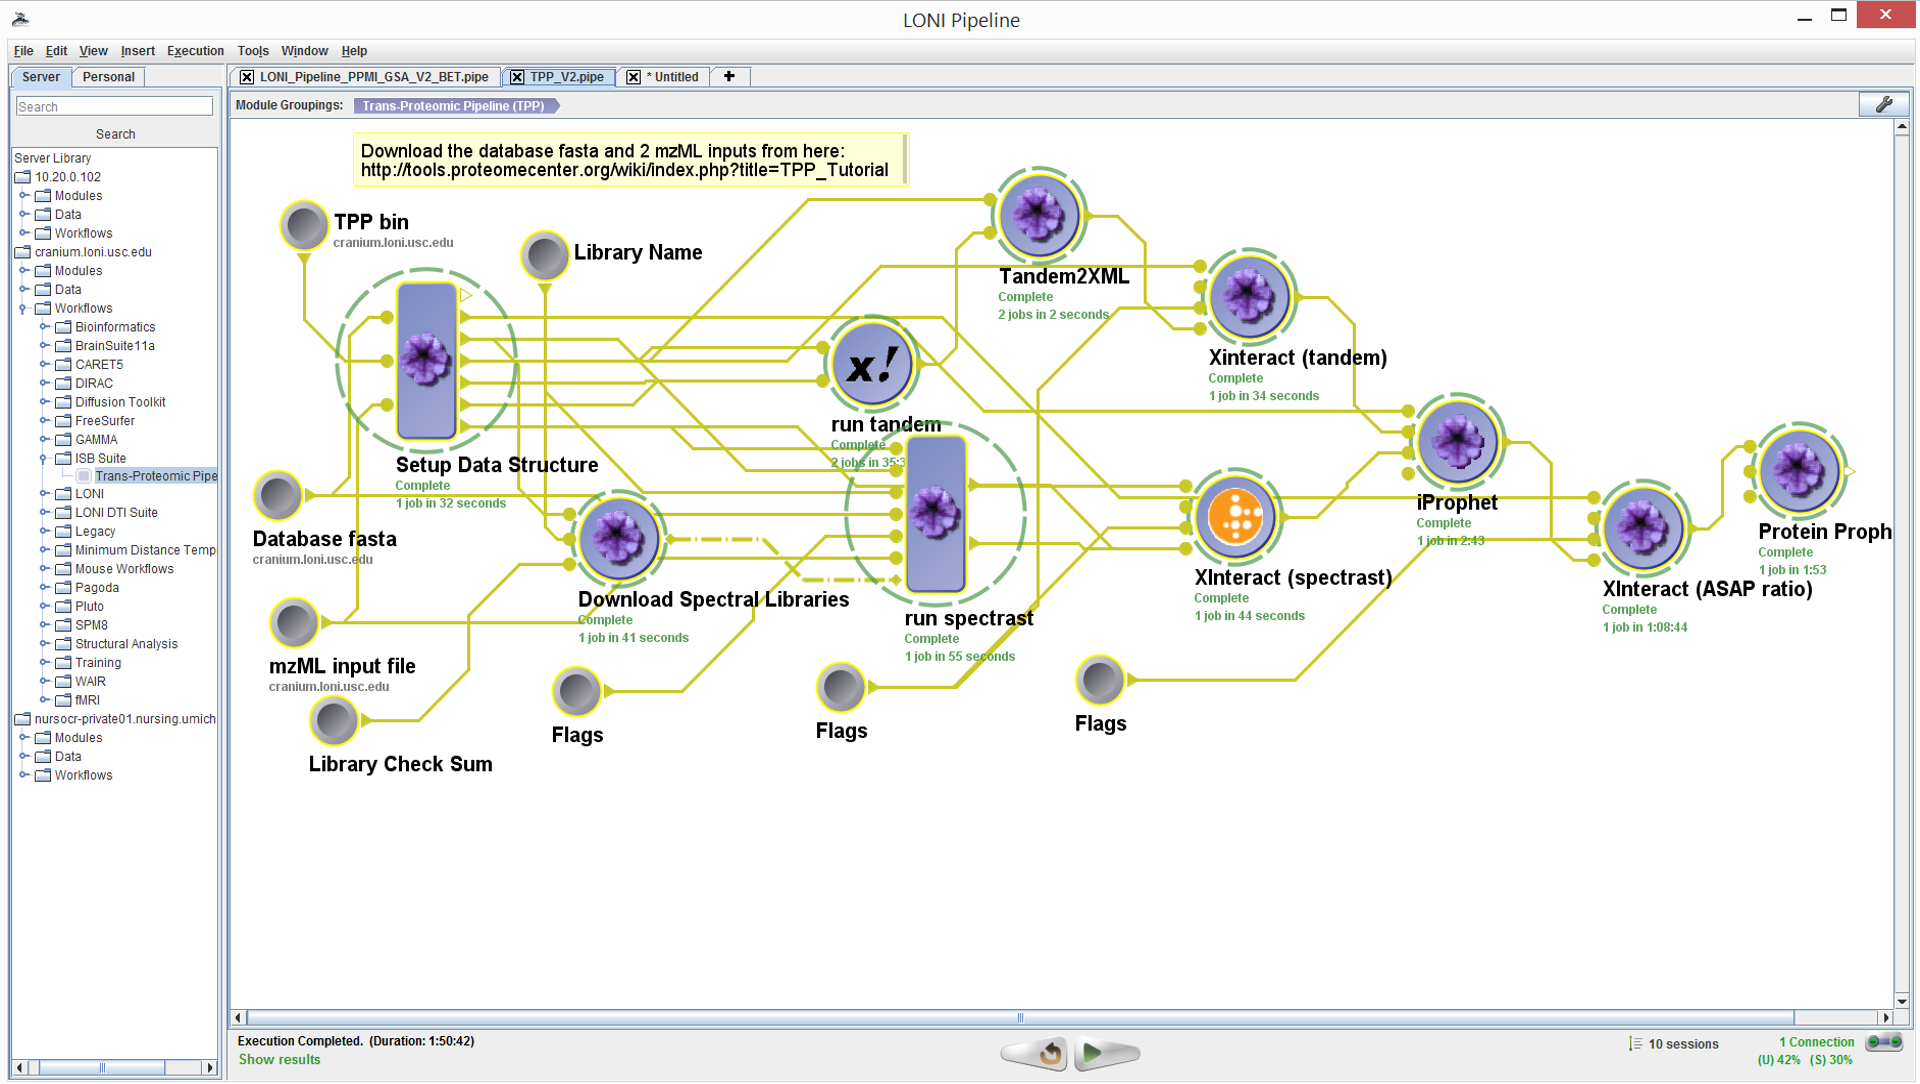
Click the Run button to initiate the execution of the workflow.
Depending on the server utilization, the workflow may take up to 2
hours to complete. See the times for completing each of the steps
(modules) in the image below. Different modules will take different
amount of time to complete based on the complexity of the
processing they represent.

Workflow Interface
The Pipeline client user interface has three main components. The
left hand panel contains a hierarchy of software tools and services
already described within the environment. The main canvas displays
the details of the pipeline workflow as a graph network showing the
flow of data between nodes, which represent atomic or composite
processing steps. The bottom horizontal panel contains the controls
for starting (playing), stopping, and pausing a workflow execution,
a server monitor, and sessions manager (important of multiple
workflows are executed in parallel).
Inputs and Controls
The sample datasets used in the TPP tutorial are already available
in in the pipeline server (or can be downloaded locally from the
TPP web-site). These are represented by:

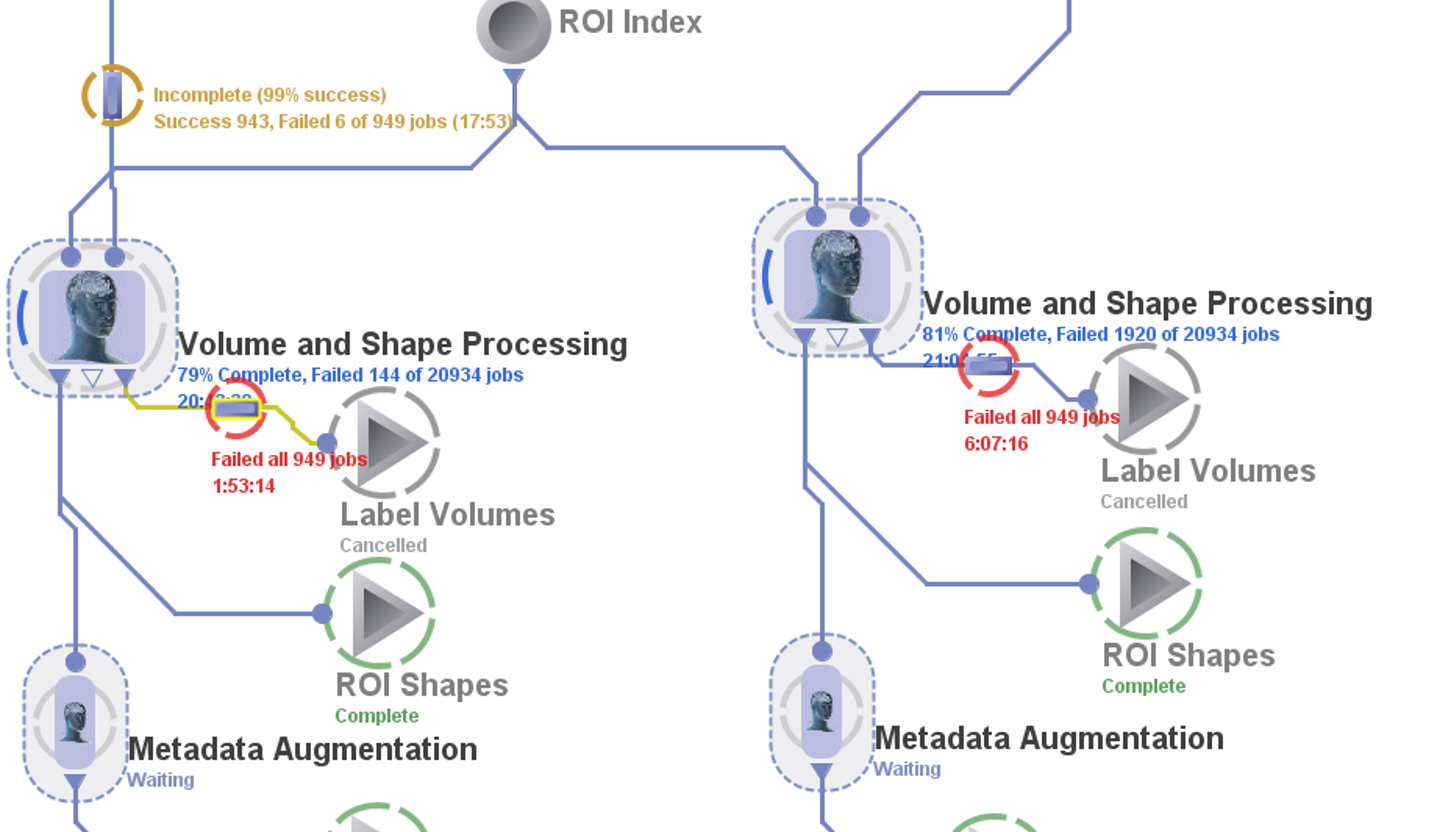
Monitoring Workflow Status
After initiating the workflow execution (by pressing the Run
button) you will see visual clues illustrating the status of the
execution. Moving Blue circles indicate ongoing execution, Green
circles indicate complete execution of a module, Orange circles for
incomplete jobs, or Red circles show failing execution.
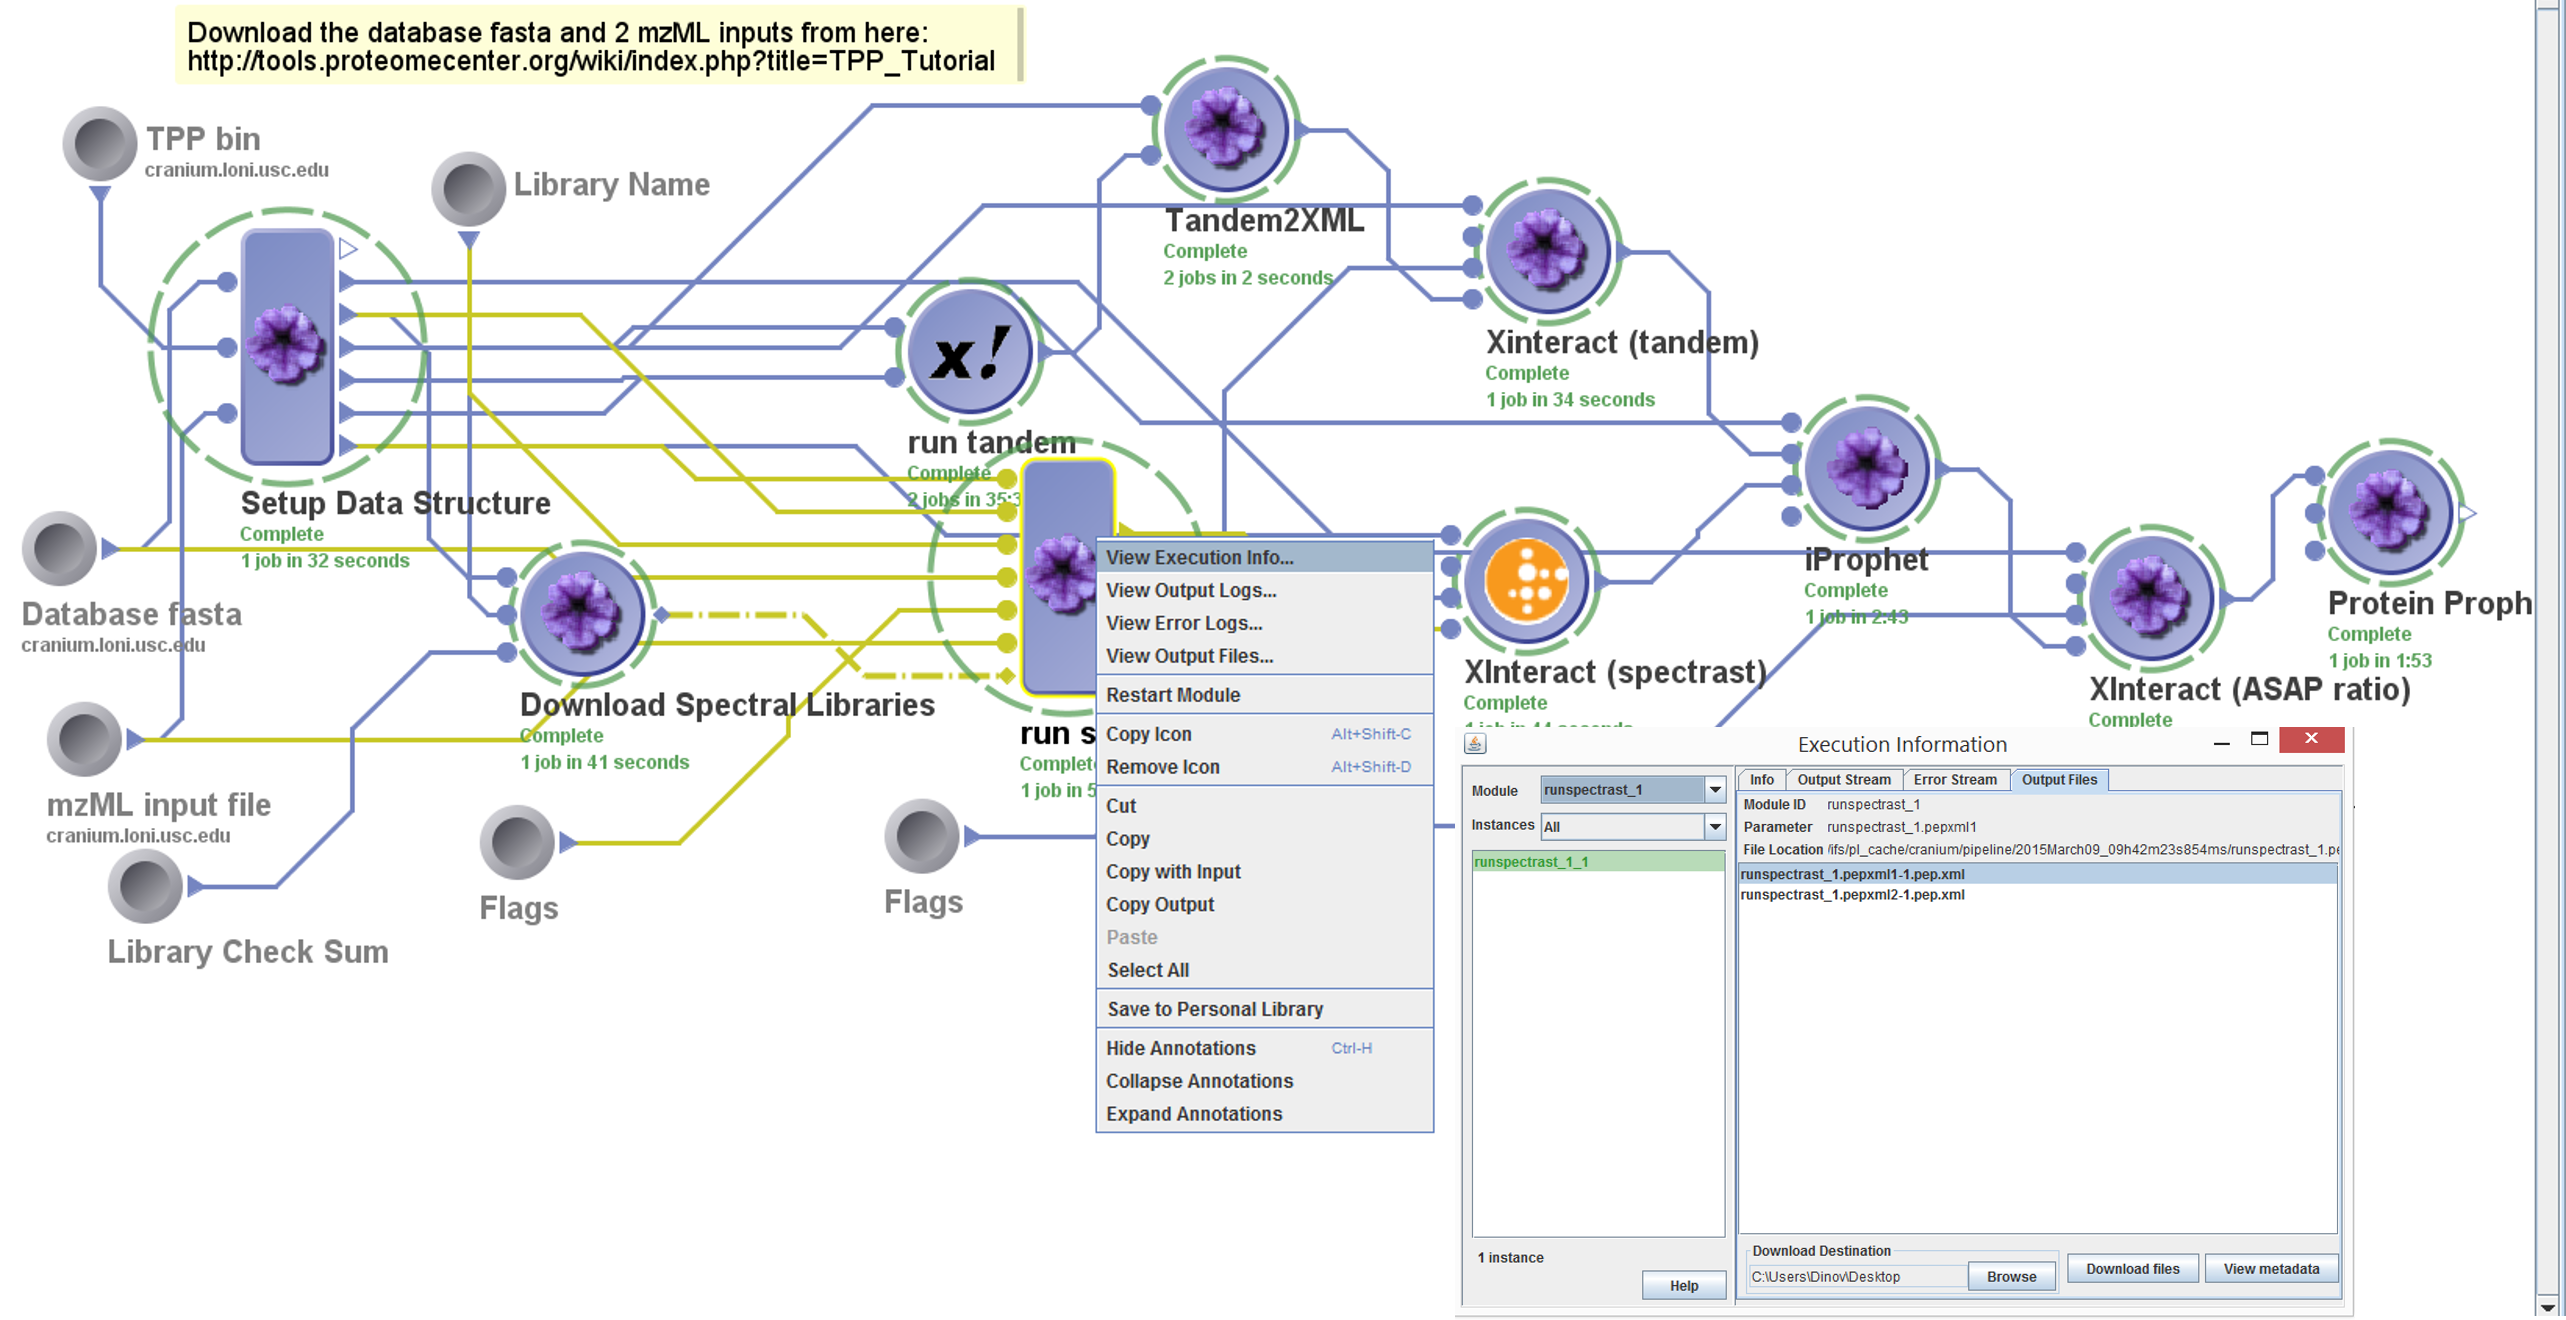
Inspect the Results
To inspect intermediate, or final results of the workflow,
right-click on a module and select “View Execution”. Then go to the
Output Files and either Download or View the results.
Dissemination
Users can further share the pipeline workflow or its results with
colleagues, as necessary.
Workflow Modification
Users can further modify the workflow by replacing specific
processing steps with other software modules, generally modifying
the protocol or expanding the workflow to include additional
processing or analytic steps.
See also